From Jairo B. García
Reaching the completion stage of a well means the companies have invested lots of time and money in exploration, geologic analysis, reservoir modeling, and drilling. Accordingly, the completion of the well is the successful outcome from those activities, meaning the commercial reserves are present and the decision has been taken regarding the best way to produce those reserves. The question here is whether the chosen completion is the optimum to exploit the reservoir, knowing that the completion is a wild card: if done properly, it will render the optimum well inflow performance, otherwise, the actual productivity will not match the forecasted production profiles of the company. Reviewing the completion performance, it reveals that unknowingly, most companies do not get the optimum results due to two facts. One is the lack of technical skills to verify the expected performance of the wells, and the other one is the lack of economic evaluations that may lead to the optimum performance. This article will show examples of each of those cases to check if this critical stage is properly assessed by the companies.
Each type of completion has their unique attributes that make them the dominant element, or the major offenders in the total pressure loss of the well inflow performance. In a perforating completion, this attribute is the length if the perforation followed by the number of perforations. In a fracture completion, the dominant elements are the length of the fracture and the conductivity of the fracture. For an open hole gravel pack, the dominant attribute is the permeability in the annulus wellbore/sand screen. For the gravel pack, it is the resulting permeability in the perforation tunnel, defined as Kpt. The only way to know if the completion was successful or not, is by attaining a correlation of those parameters. Those parameters are taking into account only the pressure drop (skin) due to the completion performance, as the other elements making up the total skin, like the reservoir skin, or the multiflow skin and others, have been separated out, which allows to quality check the inflow performance exclusively due to the particular completion.
In order to show how this completion performance evaluation is conducted, let us review a cased-hole gravel pack completion operation. The communication between the reservoir and the wellbore, in this case is established by perforating through the casing, the cement sheet and hopefully deep into the formation, contacting the undisturbed section of the reservoir. The perforating creates a small linear channel through which the total produced fluid has to pass. As the effective flow area of the perforations is very small compared to the effective flow area in the reservoir, even if the highest perforating density is achieved, this creates an exceedingly high flow velocity, which will have to be analyzed by the modified Forchheimer equation, due to this non-Darcy flow condition. This high velocity within the tunnels is responsible for creating the high skin associated with this type of completion, along with the skin due to convergent flow from the reservoir into the perforations. But the dominant pressure loss (skin), is created by the flow through the perforation tunnels.
Those perforation tunnels are packed with high permeability gravel, with the unfulfillable expectation of creating a high permeability contrast between the native reservoir rock permeability and the permeability of the gravel, which in most cases is from 50,000 md up to 200,000 md. The service providers always will recommend the highest permeability gravel in this type of completion. By matching of the permeability in the perforation tunnels as well as pressure build up tests (PBU) to define the skin components associated to this type of completion, it has been determined that the permeability in those perforated tunnels (Kpt) is not close at all to the permeability of the gravel packing them. The real fact in this case is that, there is a trend which follows the reservoir permeability (Kr), but not the original gravel permeability.
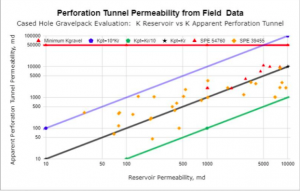
Matching the effective permeability of the tunnel and the data from the PBU test, the trends in permeability are defined as depicted in Figure 1. In the graph, the red lines corresponds to the permeability of the gravel, in this case, 50, 000 md. The black line corresponds to the found linear match between the reservoir permeability and the apparent perforation tunnel permeability, for a very wide range of reservoir permeability. From this plot, it can be seen that, for any reservoir permeability value, Kpt is equal to Kr. The blue line corresponds to a P10 case, and the Green line to a P90 case. Degradation of the gravel when it is pumped from the trucks at surface down to the final perforation tunnel and or mixing of the reservoir sand and gravel should be the possible causes for this unexpected but realistic performance.
The data used in this analysis corresponds to independent data matching established by ConocoPhillips and Statoil, following the same trend, for this type of completion.
This is the type of analysis that must be used to predict the inflow performance of this particular completion instead of using the unrealistic gravel permeability, if a confident outcome is expected from the well inflow performance.
Unconventional fracturing
Nowadays, it is quite common to find headlines mentioning the achieved records of the increasing number of fracture stages per well in unconventional reservoirs. This is the natural response to the focus on key drilling and completion technology developments, which have been the drivers to unleash significant well productivity improvement.
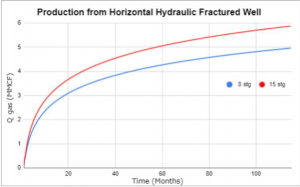
Figure 2 shows the expected increase in well productivity with increasing fracture stages. This is the argument the service providers will use to support their goal of selling more stages in any fracturing job. In this simple example, an increase of around 17% of additional cumulative production is achieved at the end of year 5, when comparing a 15-stage fracture case to an 8-stage fracture. This means, it costs almost twice the price to get an additional 17% of increased productivity.
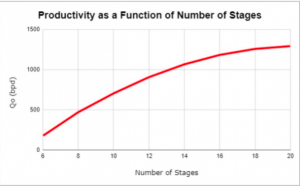
The increase in the number of stages is not a linear relationship with the well productivity as seen in Figure 3. The incremental productivity decreases with increasing number of stages. The incremental productivity attained when increasing the stages from 6 to 12 is higher than the one when increased from 12 to 16, and this is higher than the incremental productivity when the number of stages increases from 16 to 20. One of the possible causes for this performance is the fact that a higher number of stages, the fractures will compete with each other, in a reduced spacing, for the limited fluid volume to be produced. This behaviour supports the observation regarding the higher initial productivity for the cases with higher number of stages reaching a point in time, where the productivity will be reversed and so, the case with lower number of stages will overpass the higher number of stages case, which means a diminishing returns from higher number of stages.
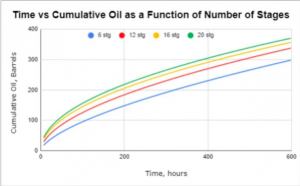
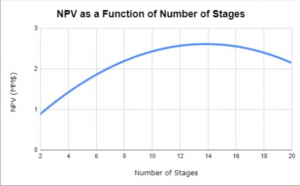
The increase in productivity is again shown in Figure 4, where increases in number of stages will result in incremental well productivity. The question then is: what is the optimum number of stages? The answer then should come from an economic analysis, and not from simple production figures.
Using the expected NPV numbers for each number of stages case, is the only way to define the number of stages that will get the optimum productivity from the completion, as seen in Figure 5. For this example, the optimum number of stages would be the range 12 to 14, which will accomplish the highest NPV numbers.
Production logging and microseismic data have established that 70% of the production comes from only 30% of the fracture stages, in other words, 70% of the stages are ineffective.
Also, it has been recognized that 70% of the wells in unconventional plays do not reach their production targets.
Those two examples show that even though there has been an outstanding progress in drilling and completion developments, still the industry should not be bragging about its achievements. I think there is still plenty of room to be humble.


Deja tu comentario